Why is this important?
Technology breeds technology, and especially so in the Life Sciences. As such, we have more tools and data in our armory than ever before. However, with this data deluge, comes complex challenges in maximizing the value of that data.
Data visualization is the graphical representation of quantitative and qualitative information to reinforce human cognition. The interpretation and understanding emanating from the analysis of scientific data can be optimized by incorporating best practices, strategies, and principles.
R&D life sciences might establish a data-visualization practice to put scientists at the center of the data visualization experience to optimize the cognitive ability of scientists in interpreting data.
What will the project achieve?
The goal of this project will be to create a data visualization community of interest that will address the needs for data visualization to support life science research and identify opportunities for communicating and implementing these best practices.
- Forge a project team to enable sharing of best practices
- Raise awareness of the value of Data Viz in the life sciences
How will the project do this?
The project will support organizations to become more aware of the field of data visualization and its benefits to enable scientists to better understand and gain insights from their experimental data.
- The team meets twice a month to share best practices.
- Developing themes of importance to the community.
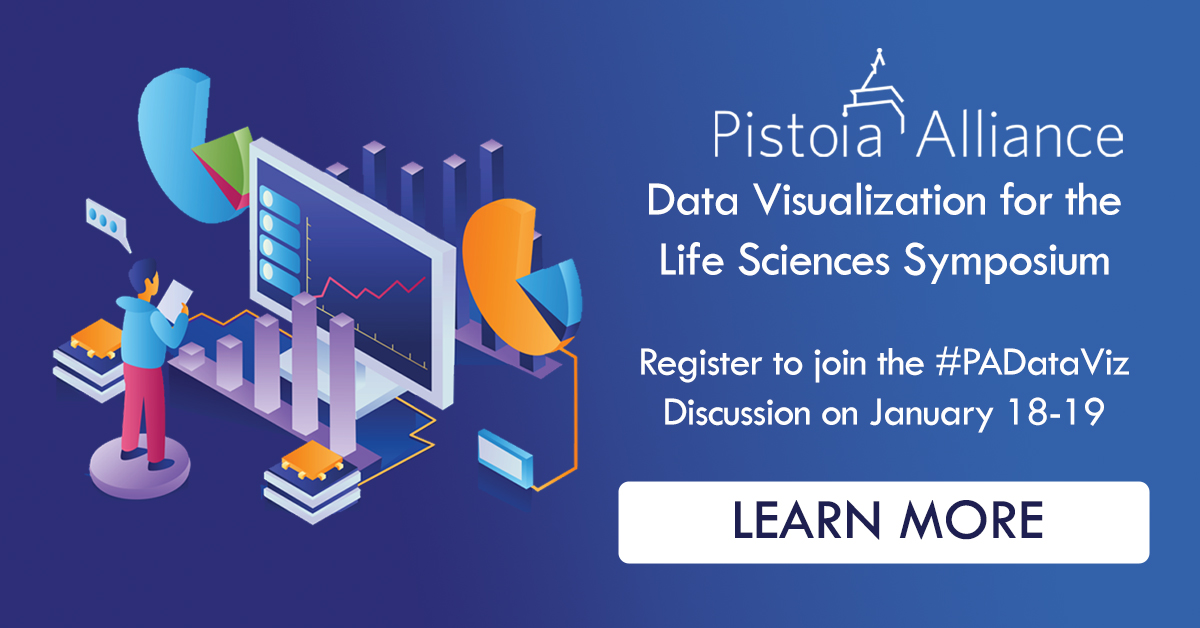
- We have delivered a Data Visualization Symposium in 2022.
Project Members
Project members include the following organizations and we are a continuously growing team. Interested in getting involved? Send an email to ProjectInquiries@PistoiaAlliance.org for details.

